Ralph Vince's Letter

Share this post
A Possible Summer Surprise
ralphvince.substack.com

A Possible Summer Surprise

The monstrous drop I and others have been expecting may be delayed yet-again

Ralph Vince
May 1
Share this post
A Possible Summer Surprise
ralphvince.substack.com

I dont ever recall seeing a battery of indicators acting so bizarre, so divergent from one another. Generally, I put out a posting only when things change, and I’ve been watching things change the past several weeks and it’s time. As I always sign out on this blog, “More as conditions develop,” and they have.

Yes, the market looks like it could collapse this coming week, in a severe drop - exactly what we have been looking for for a long time. Yes, it appears the first quarter will be officially registered as the start of this next recession. (If you doubt we are headfirst into a recession right now, just take a look at payroll tax receipt growth of late):

Something very odd, unexpected and confusing is occurring. My favorite and most reliable indicators are flipping, are going long here right now, and this confuses and troubles me.

A quick review of the six major pillars the equities market. The situation is not entirely grim here.

First, we start with Employment, which, though very healthy, is also at the levels where things can reverse and in a hurry. The most reliable indicator I have for gauging employment has to do with weekly continuing claims and those remain positive.

I like to use mechanical systems when taking the temperature of these pillars. I have a system for continuing claims which has batter 13 out of 13 trades correct since 1981, and it is currently risk-on. It flips and goes to short of current continuing claims come in at 2,980,000 and right now they are down to 1,408,000. So this is a long ways from flipping - thought when employment starts to crumble, it does so in a hurry.

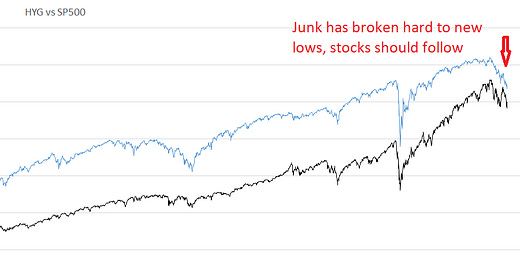
The next major leg is Credit Markets, and everyone knows the yield curve is starting to invert at least in part. This is not healthy, but we already know we are in a recession. Quality spreads however, which have been very sick, are, like employment, at a point where they can and often tend to turn on a dime. In other words, credit quality spreads have been indicating a seloff for some time, still are, but may abruptly go very positive here. The same with the direction junk has been trending. So whereas the credit markets are giving very negative signals and have been for some time, this may be reaching a point of exhaustion here now.

The same can be said of the pillar of Market Technicals, which still look sickly, have been since they peaked out months ago - metrics like Ob-balance volume, cumulative up/down volume, and the advance/decline line - all on monthly and daily data, all sick and have been so for months. But all are now in a position where they too may turn on a dime.

The charts of other market internal measures all look similar, having topped out at some point in 2021

Among the most sickly of the indicators, for well over a year now, are Valuations, by whatever measure - CAPE, Buffet, Price-to-Book-or-Sales, Tobin’s Q, the gamut, all pretty much in territory of historically high valuations, have rounded over and started down in fact. But this is not to say they too may not turn, start heading up again, and even exceed their recent nosebleed heights.

The single-most damning measure regarding valuations has to do with real earnings to stock price, which is negative, has been for a long time, and in the past, has a magnifi9cent track record even calling the October, 1987 crash:

Valuations have been insane, seem to have peaked out and be rounding over. Forward earnings are toppy, and on a real basis, stocks are facing a negative real return relative to their share prices.

Yes, this has been an emotional, feeding-frenzy, buy-everything in sight market - the kind of market where it’s nearly impossible to predict a top (I should know) and one that, each time it looks ready to crater, has just surprised everyone and, with the frothy fuel of emotion, ripped higher. All of these valuation metrics can go higher.

Looking at Economic Indicators is where things get very confusing, provocative and surprising. Perhaps because we are in uncharted waters with the recent pandemic, but despite appearances that we are now in a recession, we may be in an extremely mild one - for the moment.

The mechanical systems I keep for measuring such, from measuring activity in imports and exports, to Industrial Production and Capacity Utilization, are all surprisingly positive. The ones that are negative - Real Retail Sales and Real Disposable Personal Income, do trouble me - these are important. But my favorite among these is the Leading Economic Indicators System, which flipped back to long in February. This is extremely significant:

This is one of those mechanical system utilizing monthly data I never wish to fade (like the continuing claims system).

The final pillar we examine is we examine is Sentiment, both published surveys and actual, market-driven data. In particular, the weekly AAII survey of all-bulls, when it has gotten < 20%, has historically marked strong buying opportunities, and we are certainly there now:

The VIX futures term structure shows the contract 7 months back below the contract 4 months back. This is what we see consistent with market bottoms. Additionally, using a proprietary signal given to me from John Bollinger, we have just hit a buy day with Fridays close, the historical record of this signal, below:

My own “Drop Terminus” signal is about to give a us a buy, its history is shown below. For us to get sucjh a signal now, would require the market to close below the lows of earlier this year, then some type of reversal on strong volume to the upside. This may well happen and soon, and if it does I dont expect we will see the major drop i have been long=looking for until Autumn (and we have a major cyclical bottom due in December).

So, whereas I think there is a good possibility we are already into the major selloff, I expect in the coming days to see a totla reversal, followed by a strong Summer rally into perhaps the major selloff being again-delayed until Autumn.

One of my hard-and-fast rules is that you want to either be short, flat, or hedged anytime a day whose new lows exceed 4% of total issues traded.The history of this is shown as:

Friday’s action again saw > 4% new lows, so we dont want tobe a buyer on Monday. We dont want to be a buyer until after a day where` there has been less than 4% new lows. This helps keep us from buying falling safes, and that safe maybe really falling this week. The important point is that there are some very reliable measures now that have lined up, despite the fact that we are now ina recession, that tell us this recession may be far milder than expected, and we may see another leg up on this insane, hyper-inflated-value market before it finally gives up come Fall, with a major low due in December.

Until we have a day with less than 4% new lows, however, the bias and expectation is certainly to the downside. More as conditions develop.

Share
Share this post
A Possible Summer Surprise
ralphvince.substack.com
TopNew

No posts

Ready for more?

© 2022 Ralph Vince
Privacy ∙ Terms ∙ Collection notice
Publish on Substack Get the app
Substack is the home for great writing