


We are in the midst of a very unhealthy situation, and to buy a longer-term bullish argument here is to disregard entirely the past history of they yield curve and subsequent equities prices. The chart below depicts this on the difference of 90 day T-bills and 30 year Constant Maturity Treasury Bonds. This is ominous, and by a considerable magnitude:

With earnings coming in soft, with the looming debt-ceiling matter likely to dominate the news this week, all of the ingredients are in place for a rapid selloff this week.
Another peculiarity occurring the yield curve which has ominous implications is the inflection point going on at the 20 year constant. In bull markets, we typically see a curve of the following shape:

5 April 2017 being just a bullish period I pulled at random. Notice the 20 year above the 10 and below the 30. This is a normal shaped curve, typical of what we see in a healthy equities environment, with no inflection point at the 20.
I’ve asked people who know fixed income far better than I why this is so, why the 20 has had such interesting implications when it inflects prior to market selloffs, and I’m pretty much told that it is the “Left-handed, red-haired stepchild,” to the curve (very likely someone is reading this who also fits this description. It is idiosyncrasies that make life interesting.) I can only conclude no one knows why an inflection at 20 years has such a history of ominous implications. It’s like the appearance of, say, a comet - or a green one, in a month with a Friday the 13th perhaps. (For those inclined to go look, the next blue moon is August 30 this year).
Let’s look at the curve at other major tops of the last quarter-century. Here’s 4 February, 1999, leading up to the dot-com top:

The curve was not inverted in February of 1999, but it certainly was by August of 2010, yet the inflection at the20 year persisted throughout those 18 months leading into the top:

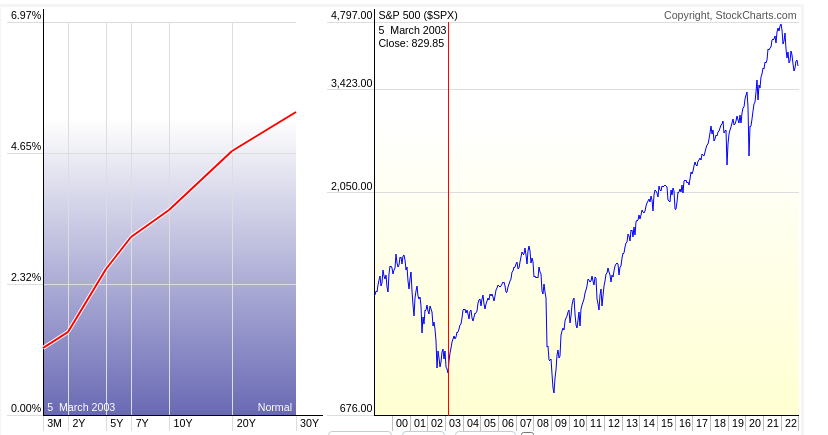
By early March, 2003, the curve is back to normal-shaped, the inflection at the 20 gone:
By late July 2007 we again have the 90 day-30 year curve inverting, and the same convex-inflection point at the 20:

By the way, the inflection at the 20 persisted throughout these bear markets, and the GFC bear market saw this inflection persist into late-Summer 2009, well after the bottom:

By August of 2019, we have a brief inversion of the 90-30 curve (but no inflection at 20 years):

By November 2021, coming into the recent top, we see that ominous inflection point appearing at the 20 again, but no inversion (yet) :

By October, we see a full-on inversion at the 90-30, and that concave inflection point at the 20 (contrast this with the bottoms in 2002 and 2009,as well as the tops that preceded them).
And to the present day:

This is not a “new bull market,” shape by any means, this is a “very serious top, sit-up-and-take-notice” shape by historical standards.
Lastly, on the very near-term, and I’ve mentioned this system in the past (paid subscribers are about to get more than their money’s-worth here) we have a Volume Tunnel sell signal as of Friday. I’ll explain the system here, but first you should read the monograph posted for Volume Bar signals. The Volume Tunnel is the best short-term system I know of.