Blowing Itself Up
Blowing Itself Up
This is likely to end quite badly in the not-too-distant future

If history is any guide - and it always has been in various degrees, then this hot, bull run since early November, and the more protracted post-pandemic, speculatively-driven, fevered run, is likely to end quite badly in the not-too-distant future.
Two factors strongly buttress why I say this. Now bear in mind, this is separate and apart from the expected 60-80% drop from all-time-high prices I expect to witness at some point in the 2020s both for reasons of the cyclical nature of long-term stock returns as well as the speculative bubble we have been in, as exemplified in percentage of household wealth in equities.
But two factors, two of the drivers of stock returns that have historically been extremely reliable, are both strongly warning us in unison of a potential very serious drop in prices.
The single most reliable of the 6 pillar of equity market drivers in the US is employment. Despite the headline number (at this point, an insane concoction of revisions) is sick and warning us.
The year-on-year (YoY) Employment-Population ratio, which, when it is negative, bodes very poorly for stocks, has just dropped to exactly zero. Very likely, with the next report in two weeks time, this will be negative.

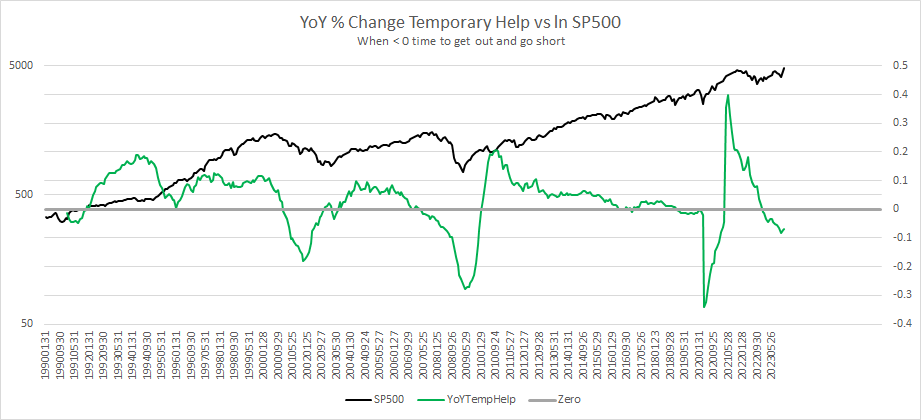
This same mechanism that seems to measure the same cycle in employment shows up more clearly in the YoY change in Temporary Help, which has been negative for several months now, an dis rather timely, historically:
Of course, as I have said often here, the most reliable measure of employment, the most reliable of the major pillars, is the 39-week channel of highest high and lowest low of the weekly continuing claims number. If we restrict ourselves to only going long when the weekly continuing claims number sets a new 39-week low, and hold until it makes a new 39-week high, we would be batting 14 wins out of 14 trades since 1980, where my data (and career) begins.

Right now, that low number is 1,658,000 weekly continuing claims or less. We’re still a long way from it.
Lastly, from pulling the daily Treasury Statement, and calculating daily payroll tax receipts, this thing has been flat lining since late last Spring, and on a non-seasonally-adjusted basis, is heading even lower right now.

This is not what you see in a strong labor market.
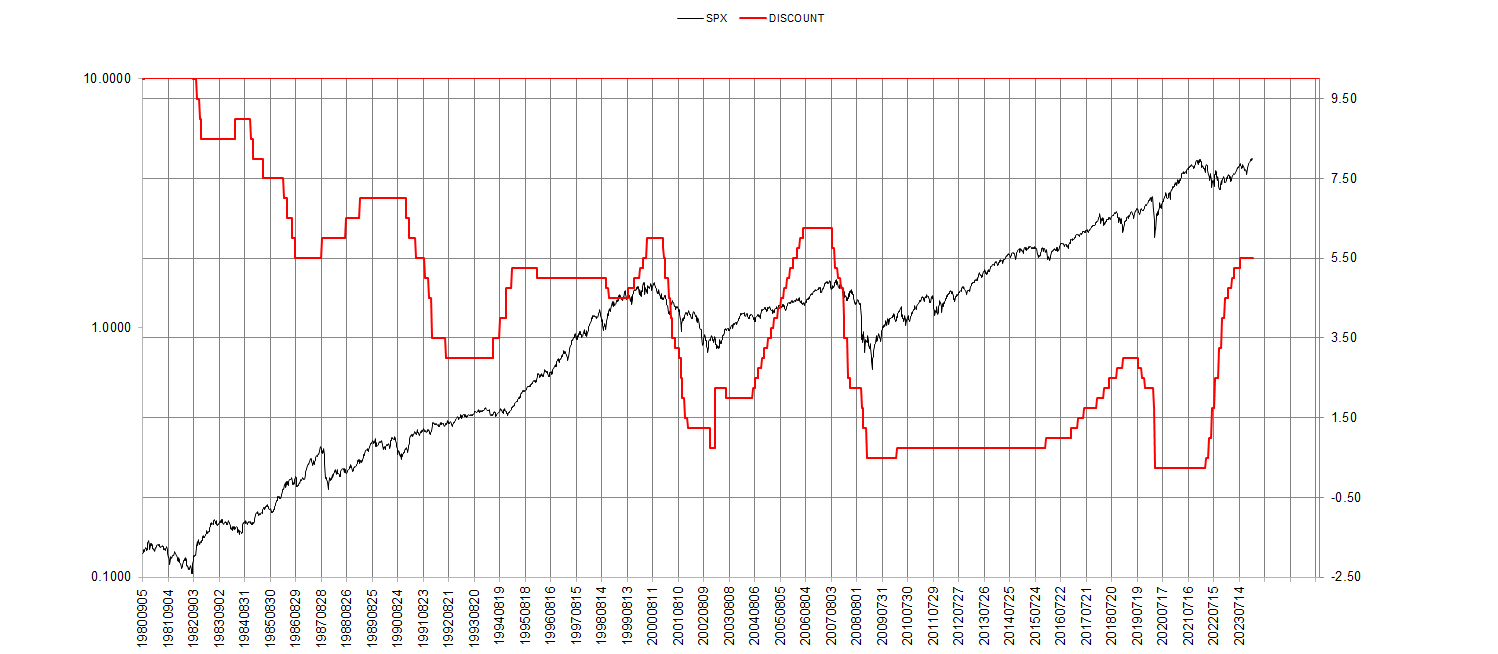
The other big pillar has to do with credit markets, and we have been in a period of a severely inverted yield curve (using the more reliable 90-30 curve) for over a year now. Most seem to be looking at this and sloughing it off, almost with “This time is different” attitude.
Few mistakes in markets could be so dangerous. Let’s review the history of what has happened this century when we see inversion in this curve.

By November of 2000,we were in a clear 90-30 inversion, just as the market was beginning to be cut in half.
In the Spring of 2007, we saw that rare inversion once again, just as the GFC was about to clobber markets

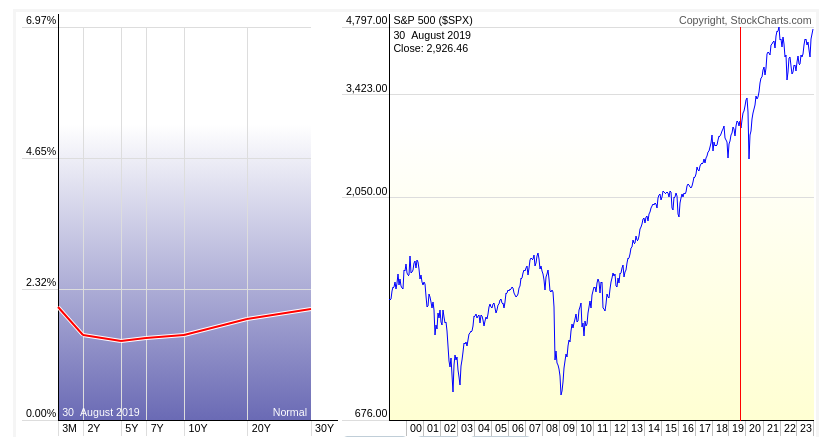
In August 2019, we saw a brief inversion, several months later, the pandemic selloff took hold.
Now we are in a very serious inversion, one which, as I have said, has been going on for over a year now!

With employment sick and the metrics going South there, and the state of the yield curve, taken together, is a damning combination — one where it is foolish to think that this time is different.
But falling rates provides fuel for stock buys, doesn’t it?
Well, that has certainly not been the case this century: