

Historical Extremes
Historical Extremes
We abut the edge of what we have seen in valuations yet-again

One very sensible measure of valuation is simply to look at the “value” of stocks versus rates. The idea being that stocks compete with fixed income. Here, I choose the 90-day Treasury. Having examined the correlation of all maturities to stock returns, interestingly, the 90-day holds up the best.
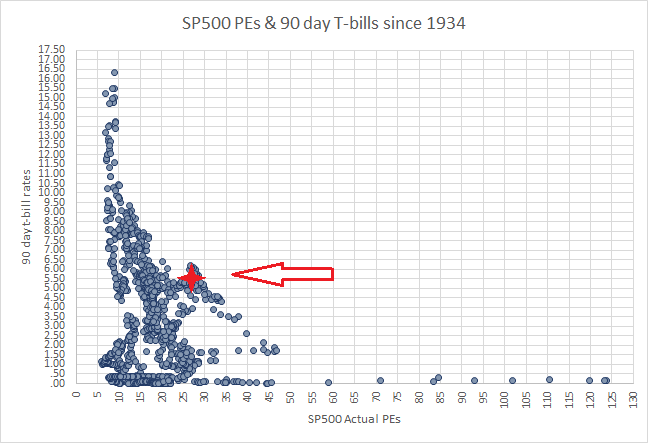
If we examined price / earnings multiples on the S&P 500 to that of the 90-day, using month-end data for each month since the 90-day emerged in January 1934, through January 2024, we see the following:

There is a very distinct shape that manifests here. In short, the value of stocks becomes dictated by rates at ever-higher rates. For 90-day rates above 10 1/2%, stocks have been valued consistently, without exception, at PE multiples of 8 to 9.
With the 90-day at 5 1/4, trading towards 5 1/2 intra-week, and a PE of roughly 27, we are abutting the edge of highest valuation, historically:
To get more precise, we dive into the breakdown of this data:

The two leftmost columns represent the band of 90 day rates, followed by how many occurrences (months) this was witnessed. This is followed by what the average PE ratio was for that band, and the most extreme PE ratios seen when 90-dayrates were within the given band. The next column is what percentage of this 90+ years worth of month-end data saw this band, then what the S&P 500 would be at the average PE, historically, for this band, and what the extreme values for the S&P would be at this band’s extreme PE readings.
At the current band (5-6% 90-day rates) we see the average PE was 18.66367 (compared to today’s reading of 26.91). The extreme reading of this band was a PE of 29.74341. If the market were to challenge this extreme reading by trading up to a PE of 29.74341, we’d see the S&P at 5480.71 (compared to where it is now, 4958.61).