


A. The Big Picture - The Everything Bubble Rolls on…
During the 2020 pandemic and shutdown (the initial “flatten he curve” weeks, followed by months of mostly social silence) we saw economic data utterly bonked. Anyone who tracks economic data - particularly when seasonal adjustments are critical, knows how polluted everything became.
What caught me at the time, was the “fishtailing,” I believed we would be experiencing for years into the future on all of this — supply issues, inflationary issues etc. Whereas once there was a rather predictable “business cycle,” where data sets were moving in parallel, peak with peaks and troughs with troughs, we have been witnessing various elements of the economic data out of sync, cancelling their net effects often, and a prolonged state of economic entropy.
And until now, thi entropy has had a generally, persistently upward bias in terms of asset prices and consumer goods, driven in the main by not only excessive government spending (by the US and others) effectively, creating wealth out of thin air (because to borrow absent the intent to ever repay is, in-effect, creating money out of thin air, and central banks around the world, actually creating money out of thin air(!), he nest result has been, by virtue of the diluted fiat currencies, the apparent increase in asset prices and prices for consumer good.
And now we see a reprise of the Trump Presidency (please don’t react - everyone always seems to even my neighbors and friends in Europe). I’m not promoting any political ideology here, and certainly not espousing mine (je m’en foutisme) as no one cares what I think about any of that. Rather, I’m trying to examine the effects of this presidency on the numbers, on the context of where are ae in the markets.
Things now have an even more unpredictable, knee-jerk element to them, something markets generally don’t care for. So amidst the backdrop of the entropy that is dependent on further debased currency, we have this element to consider as well, which is important when we discuss strategy at the end. With the current “big, beautiful bill,” as it is referred to, the fuel to the fire of further currency debasement is, for all practical purposes, unaffected and the same as it ever was.
Yet at the same time, you have a White House who is also a salesman abroad. Consider the 146 billion dollar arms sale to Saudi several weeks ago. As GDP is essentially consumption plus investment plus the balance of trade, that’s 146 billion added directly to GDP - or on an economy of 21 trillion, a bump of nearly 7/10ths of 1% increase in GDP - on that one deal alone, without considering any sort of multiplier effect. Even if spread over several years, and considering that “deals” for larger than this - for US plants, infrastructure, etc., are brought in, there is no mathematical refutation of the positive effects on GDP. And, ergo, markets.
Now let’s roll the clocks back to late 2019, early 2020. At that time we are already entering something of a bubble across all assets, not just equites, but clearly credit, real estate, even precious metals, crypto, art , collectibles— all were on a tear. Commercial real estate was booming, not just in China, but even at 42nd and Vanderbilt. As I have mentioned, even the proliferation of legalized sports betting can be viewed as part of this speculative fever.
And with what has been seen the past five years - the pandemic, the social insanity that ensued, fanned by political flames, the Ukraine war, the recent selloff from the “Trade War,” here we are again, knockings on new all-time highs in the midst of this speculative fever, this “Everything Bubble.”
But it would appear, given that certain asset classes are no longer participating (commercial real estate, for one, credit for another) that we are likely in the latter stages of this extremely-prolonged period.
Looking at the big picture in the numbers, we find households and non-profits the percentage of assets in stocks, like stock prices, at all-time-highs:

And this has historically been a magnificent, long-term sentiment indicator. If we plot out average ten year percentage returns after each point, we find a goood clustering about a projected line:
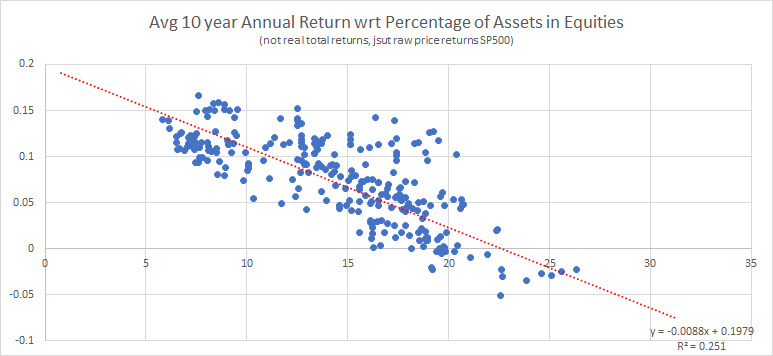
And even though the data is only through the end of last year (we are awaiting Q1 2025 data any day), with the current percentage at nearly 30, to it is nearly certain we should see returns ten years hence likely negative - and seriously so.
Yet despite this, equities continue. As has residential real-estate, although in a more selective sense:


Gold, crypto - all making regular all-time highs.
Which brings us to my other favorite, long-term, '“Where are we?” indicator, the rolling ten year, average annual real return. Here, we see four times in the past century where exceeded 12%, and roughly four times where we got to -7%, with our most recent extreme being the 12%+of late 2021:

And so we ask, what if we are, indeed, headed back to -7, -7 1/2 % ? As real, t otal returns are a function of dividends and inflation, and we used the dividends of the S&P 500 and annual, rate of change in full CPI for inflation, lets leave those where they are, and examine what S&P500 price points would be necessary to see this metric at -7.5% in for a ten year average, at each of the ten years it could occur on going forward (and, thus, consistent with percentage of household assets in stocks):

You can see the prices along the left axis, the years on the right. Thus, at current dividend yield and inflation numbers, if we were to see the annual average real total return of the S&P500 hit -7.5%, by, say, 2032, would mean the S&P500 be at about 2000 by 2032!
And we ook at what percentage drops this would mean, from te current price, if we were at the top today, and saw this -7.5% by such-and-such a year in the future:

These are some very sobering prognostications, but markets have and do such things (four times in the past century, in fact). And under normal conditions, we would expect that we are headed to such points.
And whereas we very likely may be headed there, these are not “normal conditions,” despite my wanting to resist the “…this time is different,” approach to denying the numbers.
I don’t know what I don’t know.
As we will see when we begin to peer into The Six Major Drivers of US Equities, below, that this backdrop of entropy we have been witnessing hte past 5-plus years, along with the current, pro-growth climate, we may want to entertain the idea of the “Everything Bubble,” being far-more prolonged and lasting a few years more, and what the implications would be of this. It’s something, it’s a scenario, we have to consider and prepare for, being that we don’t.
And to see why we should be prepared for such, let’s assume that, instead of dropping to -7 to -7.5%, to rolling annual average ten year real total return of the S&P were to head north here and just go back to 12%, further torturing the shorts, in line with the fiat-debasement that continues and the GDP growth we seem to be heading into, amidst this plasma of economic entropy where the cycles are still broken and out-of-sync — what would that look like?
Well here is the chart, and although it is much the shape of the -7.5% one, above, the numbers on the left-hand side are certainly different:

And here it is for the Dow Industrials. That is, for us to go back to 12% + by next year, is a Dow at roughly 50,000. If by 2027, 60,000. If by 2025? Nearly 150,000.

So let’s see what’s changed with the Six Major Pillars, and we will see they aren’t all isotopically negativeanymore.
B. The Six Major Drivers of US Equities
Sentiment
Sentiment is an indicator that only speaks when we are at extremes, and, as you know from the report several weeks ago, we had a sentiment buy signal (buttressed by other, strong buy signals at the same time) at the recent lows of the Trade War Selloff:

We use AAII numbers, published every Thursday mronign, with a buy signal givenn whenever the “All Bulls” percentage is less than 21%.
But the other sentiment indicator I love one that is not just a survey, but people utting their money where their mouths are, so to speak, that is impervious to arbitrage-induced pervasion in the data, is the difference between the 7-months-back contract VIX futures and the 4-months-back contract:

This has shown to be a realiable sentiment indicator, and as you can ese, the recent Trade War Selloff drove us to negative sentiment on this indicator that we didn’t see throughout the Ukraine Invasion, that we haven’t seen since the Pandemic.
You have to count the Sentiment pillar here as positive — at least on the short and intermediate terms (the percentage of non profits and households assets in equities is a much slower, longer term gauge of sentiment, and entirely negative there).
But from now into Autumn, sentiment is working a buy signal.
Technicals
The technical picture is quite solid - the chart patterns, moving averages, etc. Those who know me know I won he Charles H. Dow Award with Larry Williams for our work on Daily New Lows, wherein lies some of the best technical indications I know.

Favorite among these, to-me, the “Periods of Extreme Vulnerability” indicator. In short, if 65 market days (1 calendar quarter) has passed where we have not witnessed 0.32% (roughly singe-digit Daily New Lows on NYSE) or less Daily New Lows relative to Total NYSE Issues , we enter a Period of Extreme Vulnerability.
And just as we entered this period in January, in time for the Trade War Selloff, you’ll notice from the chart that every major selloff in modern times except for the pandemic, which occurred abruptly, took place in a Period of Extreme Vulnerability.
And now, just last week, we exit such a period, there therefore, the absolute earliest we could re-enter a Period of Extreme Vulnerability is in early September. That's the earliest. In other words, with history as our guide, absent some shock, don’t expect a major selloff before then per this indicator.
Buttressing this, I lok to my “Red Compression” indicator, available exclusively on Vantage Point Software:

https://www.vantagepointsoftware.com/
Red Compression warns us of big imminent moves about to happen (in either direction — but it warns they will be big) Usually, the counter move is big as well, In other words, when Red Compression gives a signal (with a very low reading — see the red arrows win the chart, above) it tells us we are entering a very trend-persisting period. With the signal (I like weekly data with this indicator) earlhy in Q1, ad the current high reading, I expect the market to cintue to grind higher in fits and spurts from here.
One of the other nice things I like about Vantage Point is how it illuminates my Volume Bars, like at the Trade War Low, clearly demarcating important market turning points. Often you won’t realize it in your price indicators, but volume is very timely, and when you see it, you need to pay attention. Vantage Point makes me see it.
I count Technicals here as positive.
Economic
One of my favorite economic Indicator Systems has to do with Industrial Production:

Like a bad dance partner, Industrial Production and stocks move along, sometimes clumsily, but to the same tune. Without getting into the specific rules of this system(it’s long-winded, Ill cover it in an upcoming letter), here is the performace for the past century or so:

Anyone who says stocks have no link to the economy has studied Industrial Production enough. That said, this solid indicator / system went long again after February’s data was reported. Again, this is why I say things are turning out there in the numbers, and we need to pay attention to this.
Another favorite economic indicator of mine is one I call The Art Vandalay System, which pertains to imports and exports.
Clearly, the difference between the two, the balance of trade, is important as it is in input to GDP. And as I’ve just mentioned, the economy and stocks are linked. But their sum, the sum of imports and exports contains worthwhile data too in terms of aggregate international trade, which is what we use in this system:

The data is only reported through April. Essentially, the system says that for each month to use the SUM of Imports + Exports. When the current months is the highest of the latest six month period, inclusively, the system is risk-on, and if the lowest, risk-off. A signal lasts until another one comes along. Currently:
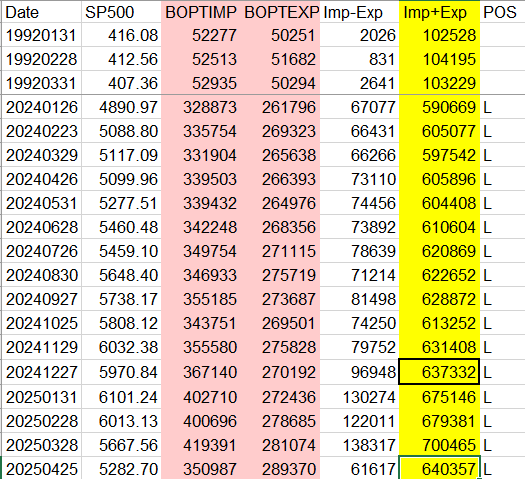
Notice the sum of imports and exports is 640357. The number in the box, 637332 is the nuber it has to be at or less with the next months reading to go risk-off. We’ll keep an eye on this one, especially in light with what has been going on with tariffs, to see if this system actually goes risk off here or not.
Rates & Fed
The fed steadfastly refuses to cut rates, and given that the two-year is only about 30 bps less than fed funds, there’s no driving impetus too. Further, I have a sense the Fed wants as much dry powder as they can, in terms of being able to have room to maneuver in terms of rate cuts, should conditions truly deteriorate and they need the ammo.
Further, their balance sheet operations continue to display a hawkish tone:

On top of this, the normalization of the yield curve we have witnessed since Q3 of last year is a very bearish omen:

As if that wasn’t enough, as I’ve often said, the most important thing to look at in the credit markets with respect to equities is quality spreads. One of my favorite ways of measuring this, despite duration difference problems, is to look at the Baa minus the ten-year:

We look at this difference vs its 18-month moving average, and this indicator has been short since March. When tings go to hell with equities, you can be quite certain this indicator will be short.
All in, the Credit and Fed pillar is decidedly negative here.
Valuations
In the chart below are the results for the best valuation model I know. Here, we are measuring, essentially, returns and payouts on stocks relative to the 90-day. This tradeoff I find to be the bas measure of “valuation” in terms of equities.
Are you better off in stocks, or just garnering interest?
The model has kept you out of some nasty markets - the GFC, the crash of ‘87. Had it not missed the runnup of the late 90s (what legitimate valuation model would have had ou long then?) its would hav outperformed buy-and-hold with a hell of a lot less drawdown). Since 1934, the model has had 26 risk-on signals, 22 of which were profitable, or a little more than 84%.
Simply put, the model is as follows: Take the quantity of the monthly dividend yield of the S&P500 times 2 plus the earnings yield of the S&P500. This entire quantity is then divided by 2, and that product divided by the 90-day T-Bill rate. If this final nuber is greater than 1, you’re on a risk-on, or long position otherwise you;re flat. The current reading is .72.

(By the way, I’m in my fifth decade at this stuff. I’ve had the fantastic luck in my life of finding myself around some great market minds, around guys who have obsessed over ths stuff, turned over every stone out there, shared things with me, and all sorts of goodies have found their way into my kicker through the years. Usually, I admit to forgetting where certain things came from — some of it is original, certainly not all. When I remember, I try to point it out. With that in mind, I think this valuations model comes from the late Nelson Freeburg and if not directly, than it is probably a reworking, re-tinkering on m part of his idea…..which he may have picked up frrom someone else…)
Earnings, both actual, reported and forward, are keeping pace:

But the headwinds to valuations are clearly the tradeoff to the credit markets, which are significant. The fact that equities are so strong here, despite the backdrop of rates, is further evidence of the speculative fever going on.) Thus, despite the earnings picture, equities appear, from a valuations perspective, to be a weaker play than simply accepting the risk-free rate, and we have to give the Valuations driver of equities a negative mark here.
Employment
Employment is the pillar that has, historically held the most sway on equities of all. I measure this elephant with a nuber of different systems, look at all sorts of data, and I can tell you that they have all gone long here in the last few months. All, that is, except for my favorite, most reliable and most timely one of all, the Continuing Claims system.
Since 1980 this baby has gone risk-on 14 times, and 14 times it has gotten out at higher values. Simply put, when the continuing claims Thursday reading (the data is two weeks late) is the highest of the past 39 weeks, youre risk-off. When it’s the lowest of the past 39 weeks (inclusively) you’re risk-on.
We’ve been risk-off since December 9, 2022.

The system is still risk-off, but I expect, given what I have going on in the other employment-based systems, for this to change here in the coming weeks or months. Then, I think we’ll really be in a serious run up.
Employment is decidedly positive here. Again, all these colliding economic waves, we dont see things in a clear manner as we might have pre-2020. And from the available data (e.g. daily treasury statement taxes collected, etc.) we might otherwise have been in recession through Q4 of 2024 (if not before) through Q1 of this year. The data clearly tells us we are emerging from this slowdown, and it s getting reflected in the employment numbers now.
In sum, in the plus camp we have Sentiment, Technicals, Economic, and Employment (the strongest) are all ether positive or turning so. Only Credit Markets and the Fed, and Valuations are coming in negative. We must, particularly against this entropy-occluded background, and getting a sense of the new Administration's reluctance to stop printing, along with their pro-growth stance, entertain the prospect that the Everything Bubble is going to go on longer and farther than we ever imagined. We either fight it, get out, or go with it.
C. Future Prospects
We don’t know what we dont know. History in the markets in a Trump Presidency has taught me to really prepare for the unexpected — which is what I am trying to do here and share.
One of the more predictable things on the horizon t hat will have profound implications on everyone’s life, is the advent of quantum computing. This spring, I found myself in something of a direct collision with this.
A lot of what I have worked on in life has had to do with the simple difference between the arithmetic mean and the geometric mean differences in data, in particular how they affect portfolio construction.
And I have always been fascinated by Borwein’s use of the AGM ( the Arithmetic Geometric Mean, as a means of convergence acceleration between two points; Borwein, along with his brother I believe, came up with even faster convergence mechanisms than this) and his use in determining Pi to however many significant digits.
And holding a rubber band, in an almost circular manner, rolling one of my wrists over, making a figure 8 with it — where did all that amazing math just go?
And my obsession with the Lemniscate, the figure 8, or “infinity symbol” arouse, and I wrote a paper on some very interesting mathematical relationships this fascinating shape reveals to us.
And along that path, it became evident that this opens a door to a type of cryptography that is impervious to quantum-computer attacks. And I wrote a paper on this, put it on SSRN, and was contacted, in short-order, by a group who wanted to create a DEFI cryptocurrency and blockchain using this methodology.
And so I got involved in this community developing the LemniChain and LemniCoin, which I believe will be available some time this summer. This will be the world’s first, true, end-to-end, quantum-resistant blockchain, with doubly-signed blocks, not just by my novel Lemniscate AGM Isogeny Problem (LAIP) encryption, but also by other NIST-standard quantum resistant encryption mechanism. Thus, the Lemnichain and its corresponding coin, he LemniCoin promise to be the most secure cryptocurrency ever.
As part of the community developing this quantum-resistant DEFI ecosystem, I am to allocate some of the coin to others, and plan to include those who have an annual subscription here to be part of the LemniCoin airdrop wen it becomes available.
D. Strategy