

Strategy for a Grinding Bear Market
Strategy for a Grinding Bear Market

Yes, this shows every sign of being a “grinding-style” bear market. That’s not to say things couldn’t blow out in a hurry - they certainly can, particularly with the seasonal backdrop at the moment.
And there are some positive signs out there. For one, equities have, historically, performed well after periods of inflation which was tamed — which may or may not yet be the case.
Secondly, as you can see graphically, below, dividends per share are still increasing, something that goes hand-in-hand with the historically upward drift of the equities indexes.

I’m not perpetually bearish. I simply try to follow the numbers in the historical context. Without going into detail about those long-term aspects I frequently mention here, primarily (A) The ten-year rolling real total return of equities, and (B) The percentage invested in equities by the average household, these things are decidedly negative, and indicate a drop of roughly 50-80% of off the highs. And although these highs were made in late 2021 / early 2022, they have certainly been challenged, creating what could, at some future point, be considered a “double top” formation in the broader indexes.
Such would indicate that any drop below the lows of mid-October 2022 (the very day we told readers here, midday, to go out and buy “anything they could get”), would have ominous, negative implications.
So I remain bearish, I acknowledge we are in a bigger-picture bear market (which has seen the typical, strong bear market rally which the bears off the 2000 and 2007 tops never really witnessed - so it was due), but one which is, as evidenced by the activity in the options market, likely to not be so accommodating to a quick market smash (despite my concerns over equities market liquidity), and more likely - at least as things appear at this time, to be of a slow, ugly, grinding sort. These are the types of market s where investors become restive, and a slow attrition begins to take place (already evident in the daily volume numbers).
Our strategy, therefore, is to maintain a core short position, but at the same time, look to trade the short side through this with shorter-term signals.
And right now - those are still short. We haven’t seen the sort of volume and technical setup to tell us to cover half of our short position yet. When we do, readers here will be notified.
That’s the strategy for this type of market.
I’d like to point out a few things before closing. Regular readers have seen many tools and systems garnered over the years which I’m employing here, and one of the best for simply being on the right side of things the majority of the time - one I defer to when things are looking very ambiguous, is the 52-week average of the Goldman Sachs Commodity Index to weekly continuing claims numbers.
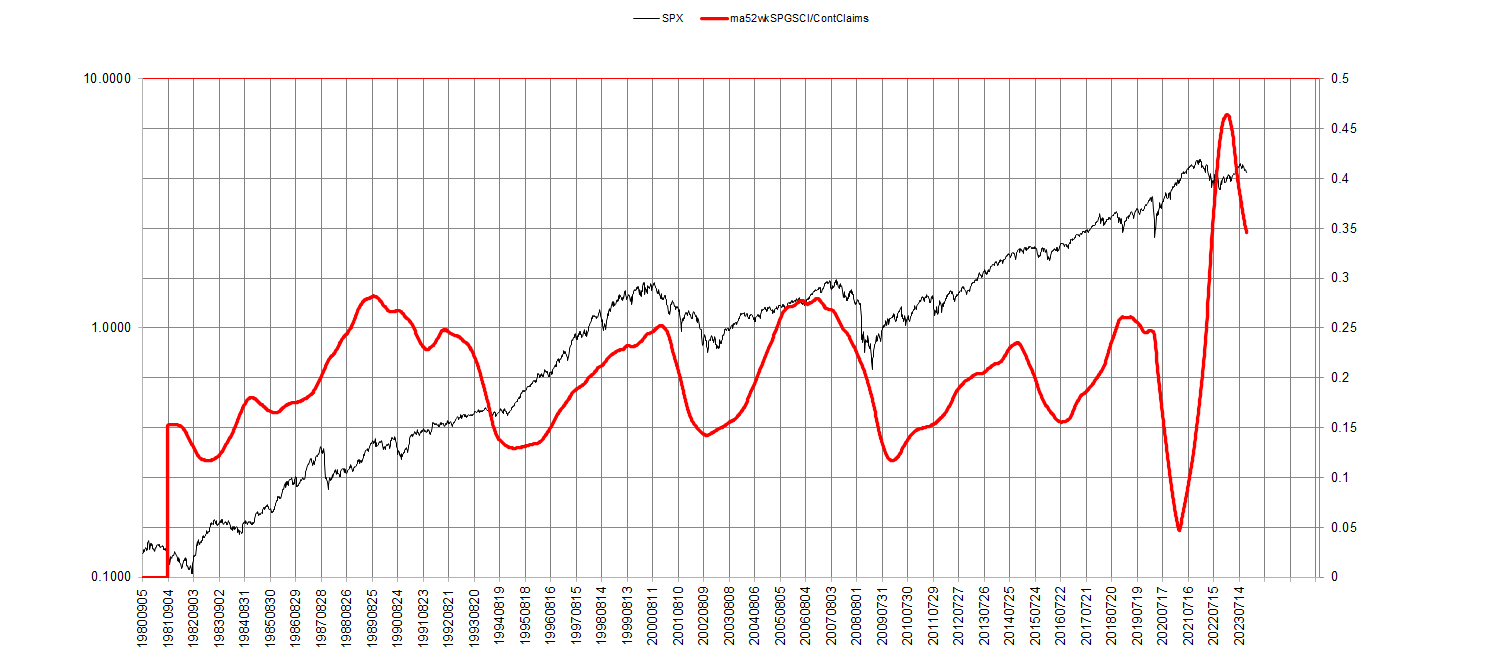
This has generally kept you on the right side of things. Particularly at this time, where there are some indications that others believe we are in a bill market, I defer to this indicator. If things were to takeoff and get going, we won’t be too far from the bottom if we are wrong.
Secondly, regular readers know I try to assess things, longer term, not only by points (A) and (B) mentioned above, for an initial perspective, but then by the six “pillars,” the drivers of the equities market as I call them:
Valuations
Employment
Sentiment
Technical
Credit Conditions
Economic Conditions
And we have systems developed over the decades to assess these conditions. All are still negative currently, based on our systems, save for sentiment, which is neutral and only matters at extremes (although long-term sentiment is decidedly overly bullish. The stonk mania, etc. seen at the top of 2021/2022 is still “fresh” in a long-term sentiment sense, and it would be a mistake to discount this here) with employment being the one with the greatest effect on equities. Not only are all of my employment systems negative (despite the roaring numbers being “reported” each month), but beneath the surface, things are very sick indeed. I suspect we’re headed for a very hard-landing with payroll taxes collected (having flat lined at -30 to - 40% below the previous 12 months).

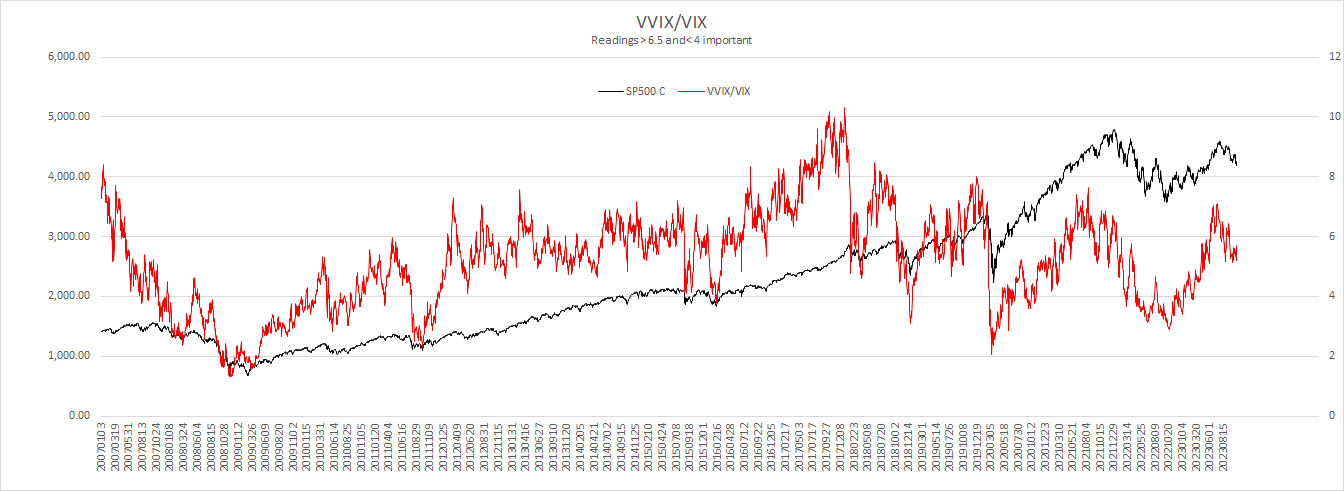
And this market potentially has a long way to fall even between now and year-end. The ration of VVIX - the volatility of VIX, itself, and VIX, has usually peaked before the market peaks. This indicator peaked in Mid-late Summer and doesn’t offer much support until considerably below current readings:
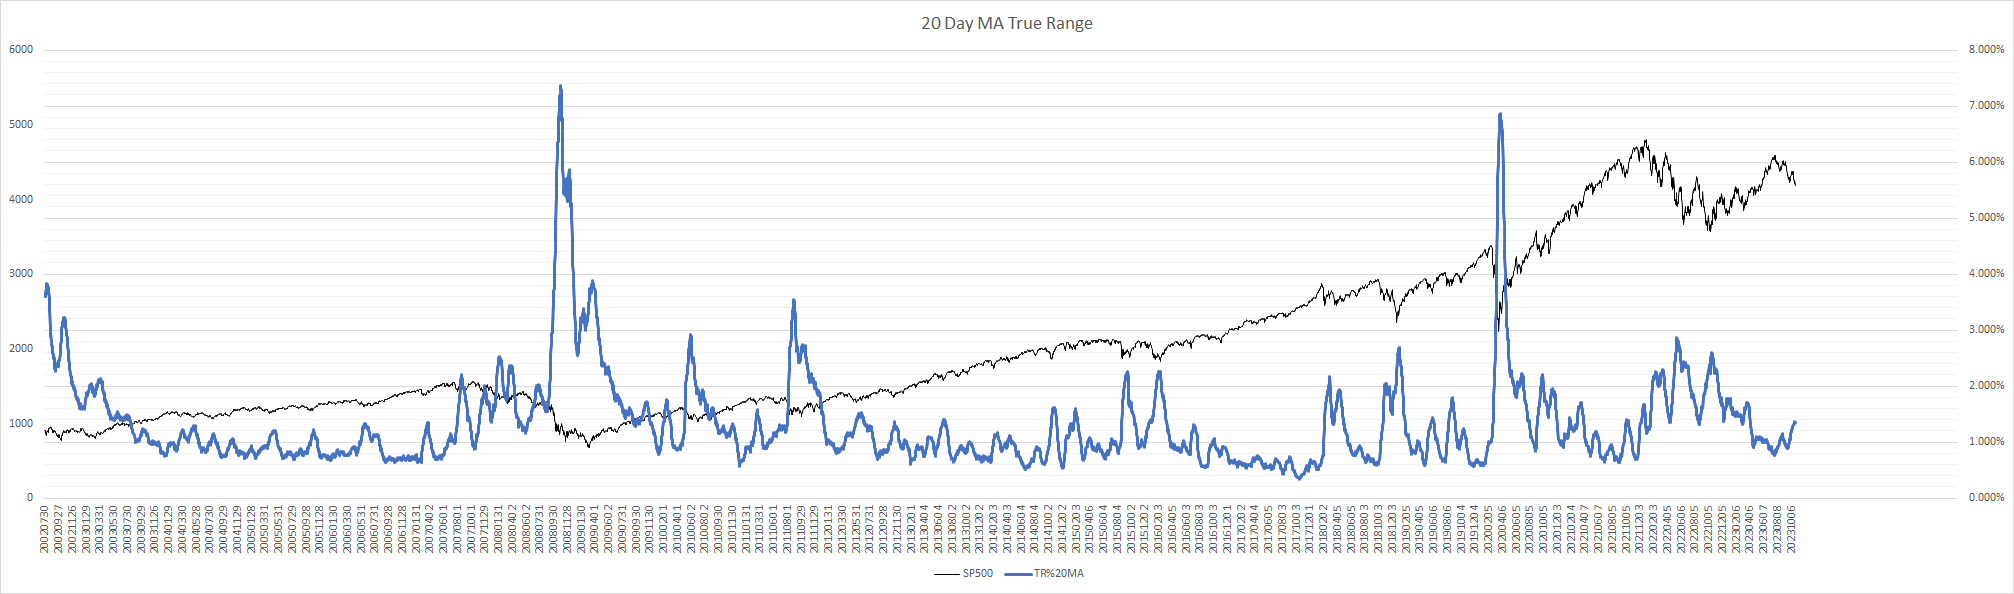
So what would it take for us to see at least an interim bottom? For one, the 20-day rolling average of true range in the S&P almost always exceeds 2% in any serious selloff. This is something we haven’t seen since the Summer of 2022. Until this happens, I wouldn’t even begin looking for an interim bottom.
Another great indicator along these lines is the late Jim Alphier’s “Urgent Selling” indicator. When this flashes, you can start looking for a bottom. Again, we haven’t heard from this one since the Summer of 2022 either.

And lastly - perhaps most importantly, daily new lows. Regular readers know that this number, the most overlooked and unsexy of the breadth indicators, is the one most rife in immediate, actionable information. Among other indications, serious market selloffs see this one exceed 30%. And again - not since the Summer of 2022.

These are all measures I am looking at daily to prepare these reports. I have others that are timely to within a day or week of a market bottom that are part of this process as well.
For now, the grinding bear continues. We could see a massive blowout - but if we do, it’s