
Waiting to Reset
A little more patience

[Apologies to readers — while travelling in mid-April, I had my laptop stolen, which had a considerable amount of software I use in putting out this letter. I have other laptops with this software on them, ready to go, but they are sitting in the US, waiting for my return in a few weeks.]
It’s taken over a month, waiting for this market to reset to a good buy-zone, but we’re still no there yet. I had assumed a good, panic-instilling news item would likely get us there, but instead we’re into the Summer ennui already.
Two main things to understand. The first, is that we are in a larger bull move, which, itself, is in an historically expensive market by valuation purposes. Never has the market been more expensive, and never has longer-term sentiment been more bullish either (further evidence of this can be seen by the money going into AI). Yet, this is still a bull market, and, shorter-term, we’re looking at a pullback within it (since May, quite specifically).
The second main point. The next move on rates is UP. The average weekly fed funds minus the 2-year constant maturity has now fallen below 50 basis points. EVERY TIME this has happened (without exception) the next rate move has been up. It’s as if the Fed, in determining rate policy, only considers the near end of the curve and when too steep, raises, and when steeply inverted, cuts. These moves tend to continue until another such condition presents itself.
Period. All other discussion about the direction of Fed rate hikes or cuts is subordinate to this history.
And such action is consistent with bull markets in equities.
Consider our model for 90 day rates, which uses inflation and employment as inputs. I’ve been keeping this model, out-of-sample, for nearly 3 decades now:
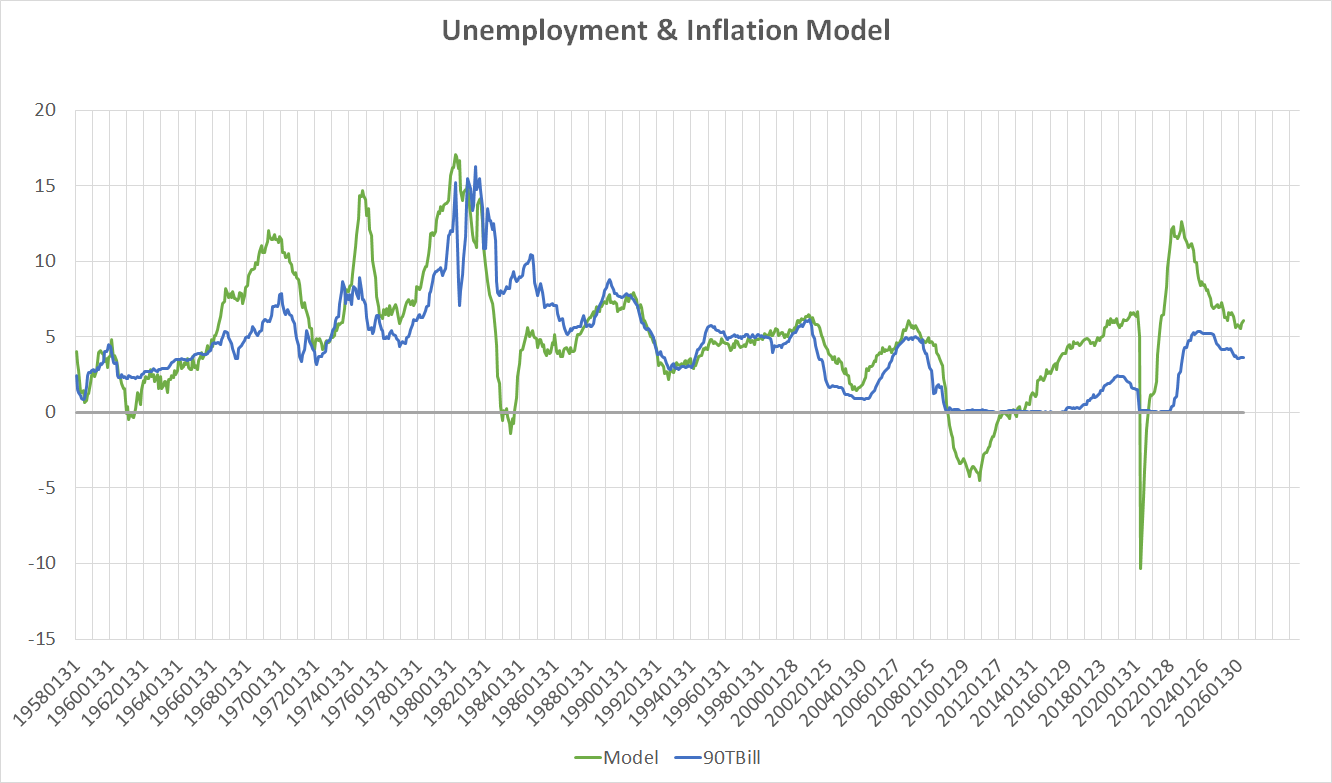
The blue line is the actual 90-day T-bill rates, the green line, what they should be, based on the model. Generally, the blue line chases the green line.
Note that the green line is over 6% ! In other words, at teh current employment situation, with current inflation, we would, historically, expect 90-day rates to be a little over 6%, not the 3.6% they are currently.
Now, that said, we also see that since the beginning of the year, the Fed has again begun expanding their balance sheet. Also recall at the beginning of the year, the credit markets were getting a little twitchy, something that seems to have calmed now.
Tomorrow is the big CPI print, Thursday PPI. Month-on-month readings can be noisy, and are always measured against the expectation for the print. Nevertheless, the numbers are telling us that inflation is on the march again. History, during my lifetime, has demonstrated that the only way it ultimately gets crushed is through much higher rates the suffocate economic activity.
We are nowhere near there yet, but, with history as a guide, that’s a rough outline of the path I think we’re on. There’s much bigger problems in this fight than there were 4 1/2 decades ago.
For one, interest on the national debt consumes a much greater portion of revenue. If rollover starts pushing out duration, that’s the tell; we’ll know that’s the longer-term actual plan to combat inflation with both the FOMC with assistance from the Treasury Dept. on the rollover menu. To carry considerably higher rates will mean pushing out maturities farther out on the curve for the time being.
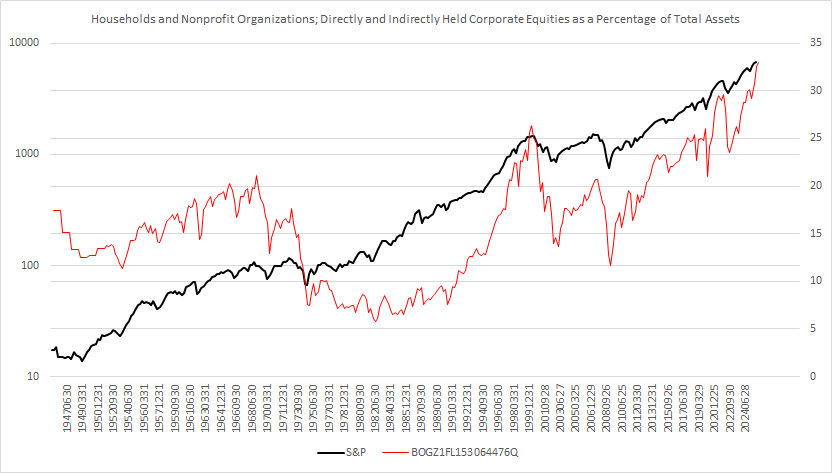
This is worth bearing in mind for long-term market positioning. Remember, we’re in a bull market in a dangerous backdrop of over-valuation and exuberance (never before has the percentage of households held more assets in equities than now)
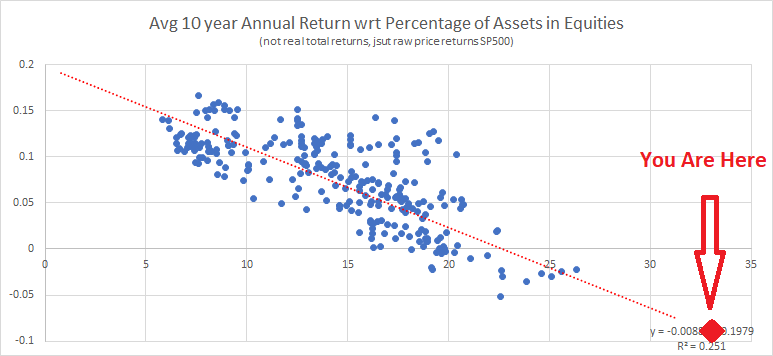
And the ten year returns following each reading fall into the following with a rather tight clustering around the simplex-fitted line:
This bull market, therefore, would seem to hang almost entirely on what is going on in the rates market. At lower (90-day) rates, stock valuations see impregnable to rate changes:
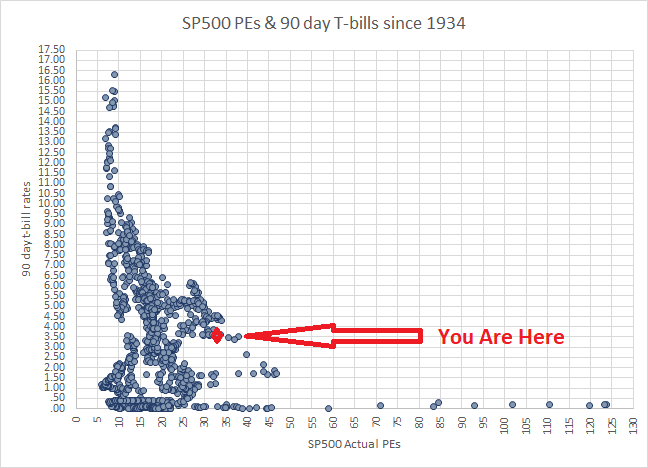
Notice in a ZIRP world, PEs can be all over the place. However, as rates go up, PEs must comport to an ever-tightening band. Historically, as you can see, there’s been no support for current PEs at even 5.25-5.5% T-bill rates. Over 6.5% T-bills, and the highest PEs ever seen have been around 17 or so. We are currently at a PE of roughly 32. You can pretty much see what rates — inflation, can do to this market now, and how that might comport to the longer-term view. If and when that cracks, we are in a very bad situation.
Short-term outlook
As mentioned, we’re looking for a drop here to reset long positions for this continuing bull move (while ever-eyeing the credit markets and inflation).